Branded assessment reports, driven by your data

Keep your report design. Make it data-driven.

Import a PDF or start from scratch. Connect your data to create personalized reports with dynamic scores, charts, and recommendations.

Google Sheets, Excel and CSV. Free plan, no card required.

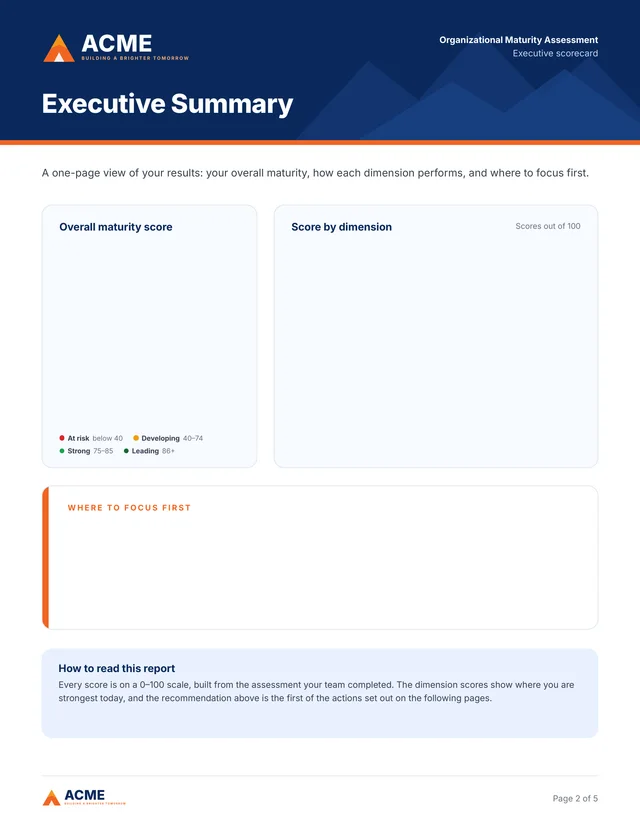
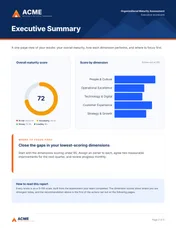
One page of an existing assessment report design, as a PDF: a navy header with the title Executive Summary and empty cards for the overall score, the score by dimension and the first recommendation. It contains no data.

Your existing PDF

A report design you already have.

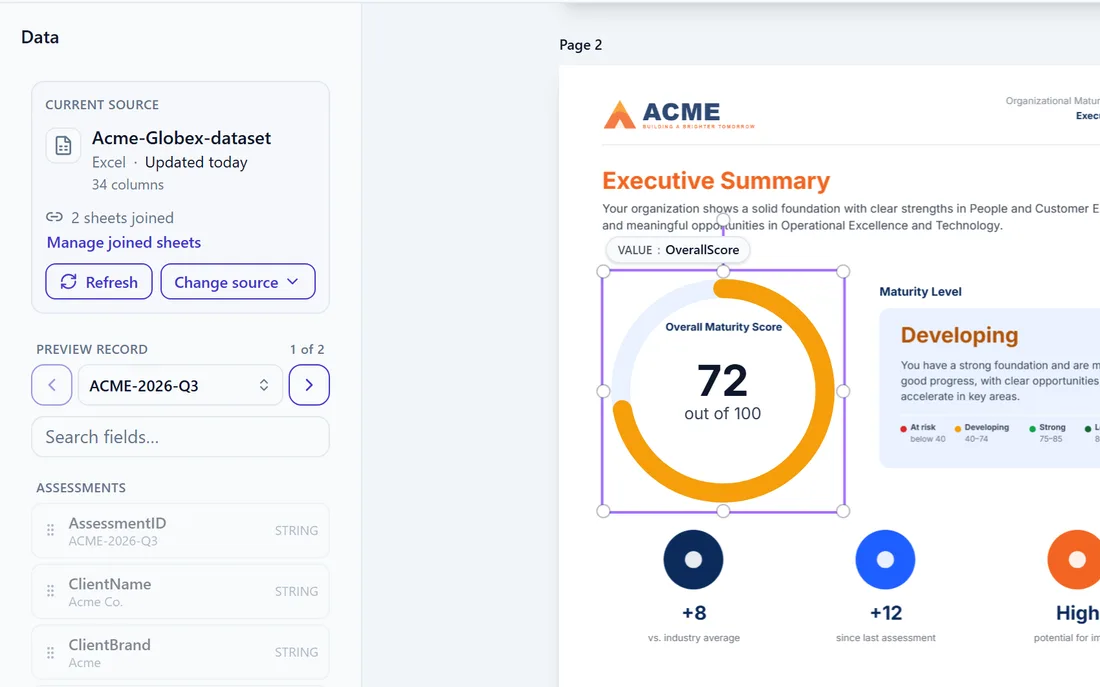
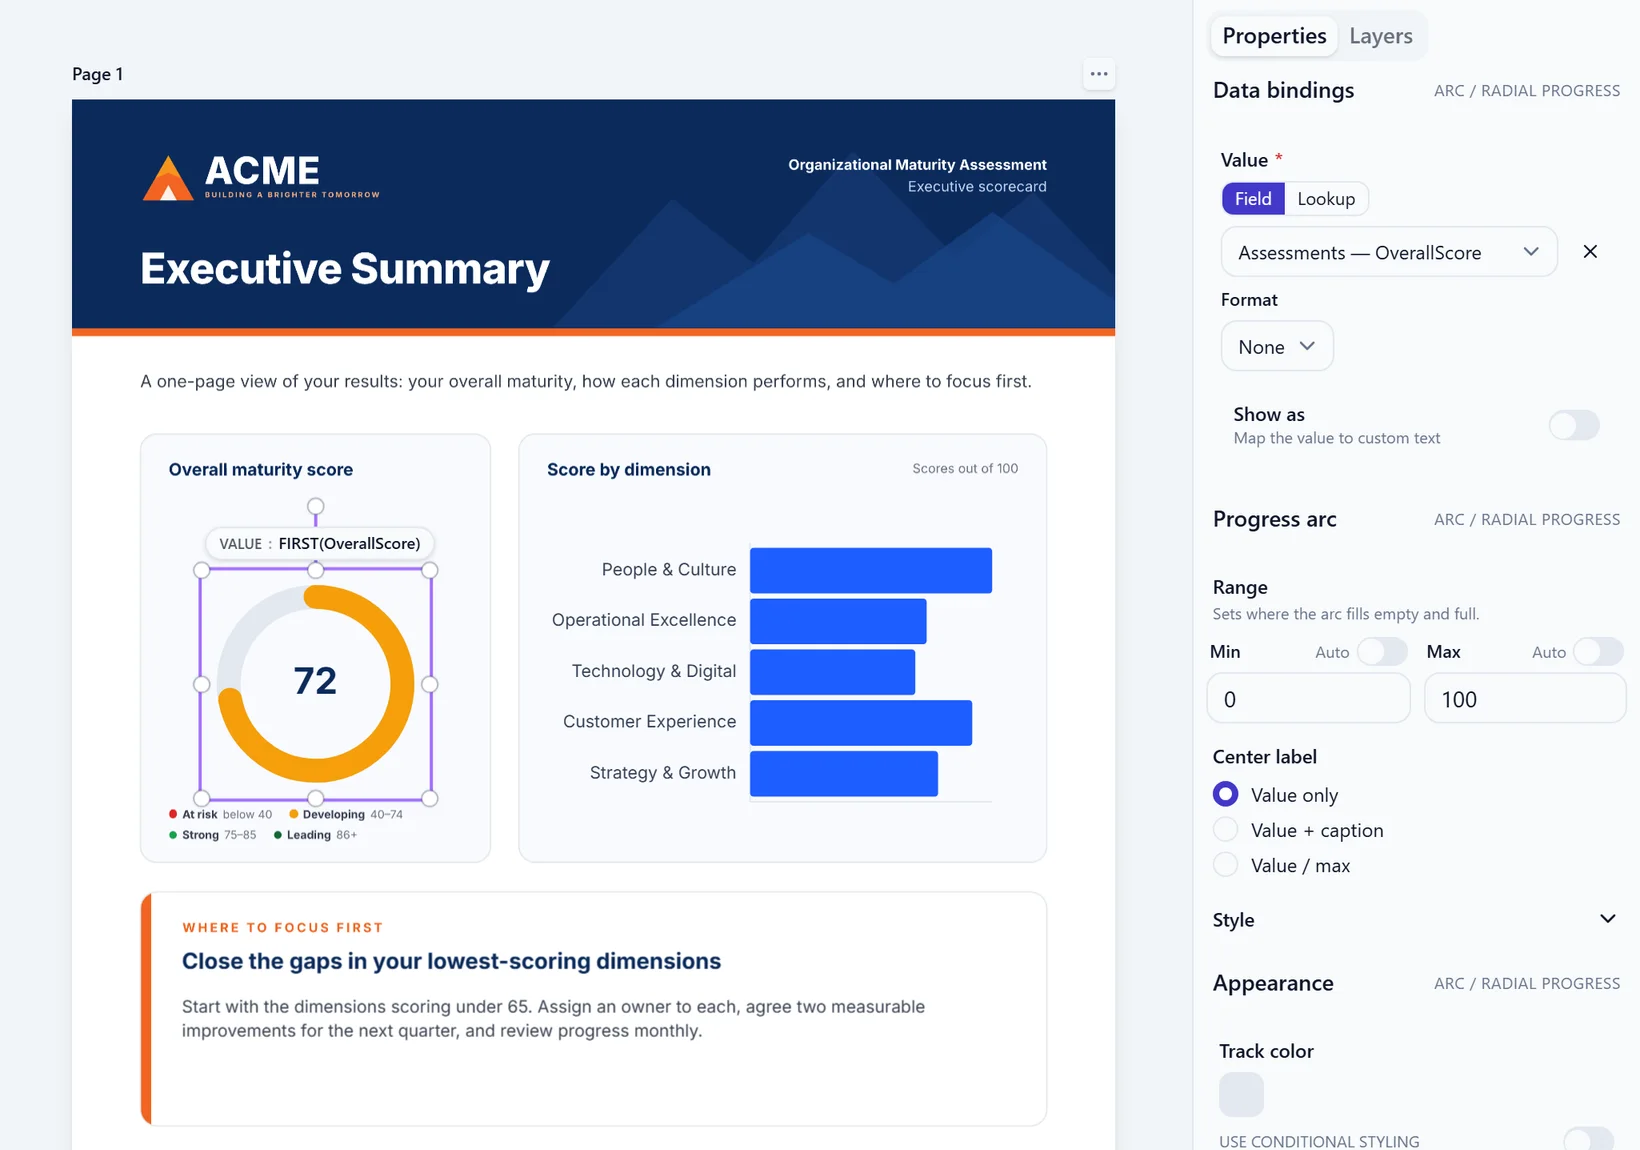
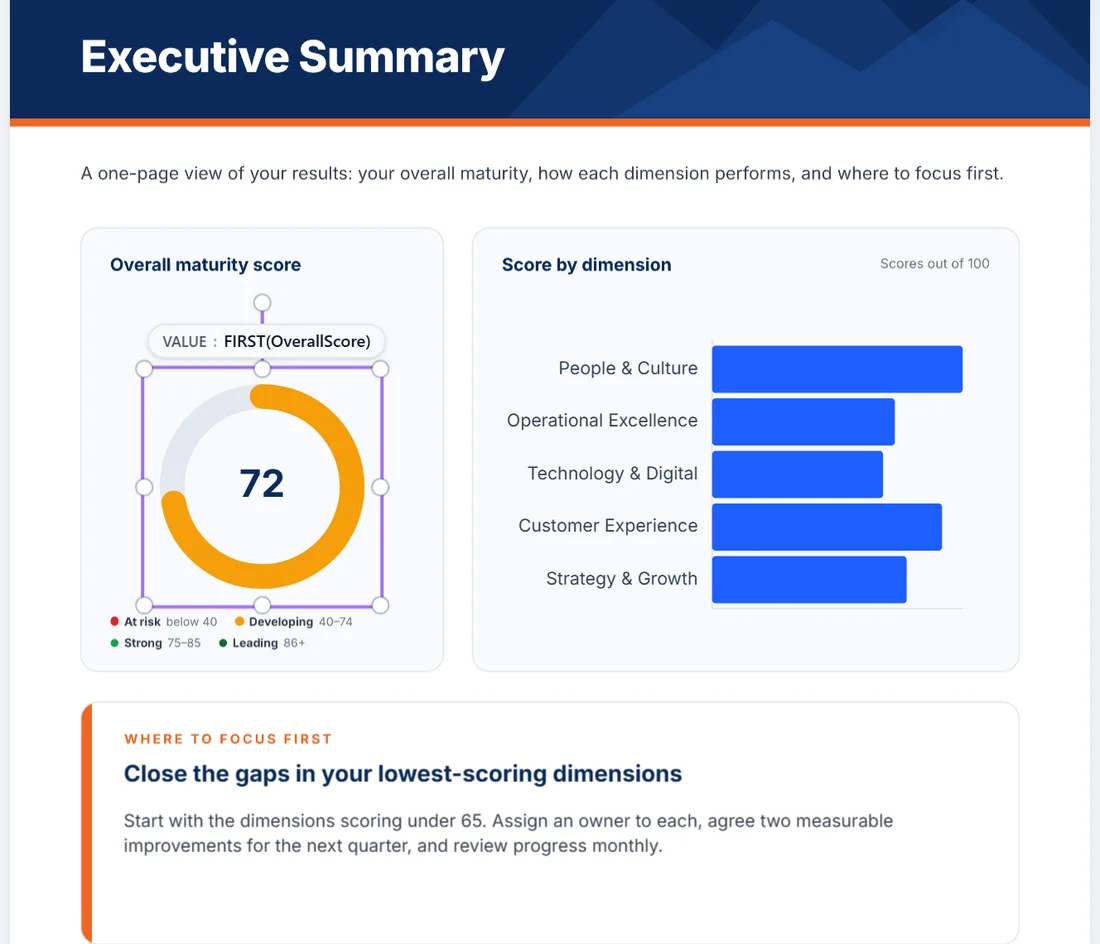
The same page open in the product editor as the page background. Three live elements sit on top of it: a score gauge reading 72, a bar chart of five dimension scores, and a recommendation. The gauge is selected and outlined, and the properties panel beside it shows the gauge is bound to the overall score column.
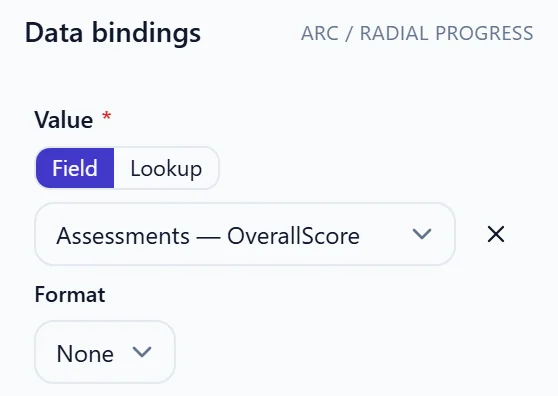
The properties panel of the selected gauge, showing its value is bound to the overall score column of the spreadsheet.
  1. 1A score read from your sheet
  2. 2A chart drawn from the data
  3. 3A recommendation chosen by your rules
Already have a report design? Import your PDF, add live data, and generate personalized reports without starting over.

Works with the tools you already use

Direct
Google Sheets · Excel · CSV
Via Sheets
Jotform · HighLevel · Typeform · Zapier · Make · n8n
Via PDF or SVG
Canva · Figma

Sources marked Direct are connected or uploaded in Framefarm. Tools marked Via Sheets write their rows to a Google Sheet that Framefarm reads: you set that up inside the tool, and it is not a Framefarm integration. A design made in another tool is exported as a PDF or SVG file and then imported. Every combination produces a PDF report.

One template, every client

Same template. Different client, different brand.

Pick a client. One row of data sets their logo, colors and font along with their scores, charts, status and recommendations. The design itself never changes.

The row in your sheet
ClientLogoBrand colorFontOverallLevelPeopleOperationsTechnologyCustomerStrategy
Acme Co.#F26522Inter72Developing8562587866

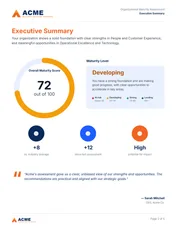
Showing the report for Acme Co.: overall score 72 out of 100, level Developing.

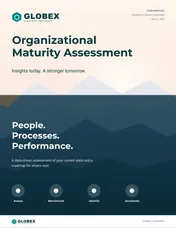
Organizational Maturity Assessment
Executive Summary

Executive Summary

Your organization shows a solid foundation with clear strengths in People and Customer Experience, and meaningful opportunities in Operational Excellence and Technology.

72out of 100
Maturity Level
Developing

You have a strong foundation and are making good progress, with clear opportunities to accelerate in key areas.

  • At riskbelow 40
  • Developing40–74
  • Strong75–85
  • Leading86+
+8vs. industry average
+12since last assessment
Highpotential for impact
Acme's assessment gave us a clear, unbiased view of our strengths and opportunities. The recommendations are practical and aligned with our strategic goals.
— Sarah MitchellCEO, Acme Co.
Page 2 of 5
Organizational Maturity Assessment
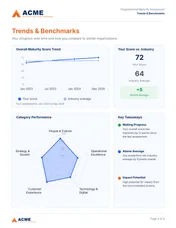
Category Breakdown

Category Breakdown

Your score, status and industry gap in each of the five dimensions

Score by categoryScores out of 100
  1. 85PeopleStrong+13 vs. industry
  2. 62OperationsDeveloping-6 vs. industry
  3. 58TechnologyDeveloping-6 vs. industry
  4. 78CustomerStrong+8 vs. industry
  5. 66StrategyDeveloping+4 vs. industry
Your score vs. industry average
  • People
  • Operations
  • Technology
  • Customer
  • Strategy
Your scoreIndustry average
Page 3 of 5
Organizational Maturity Assessment
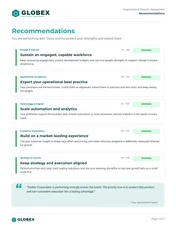
Recommendations

Recommendations

Focus on these actions to close the gaps and build on what already works

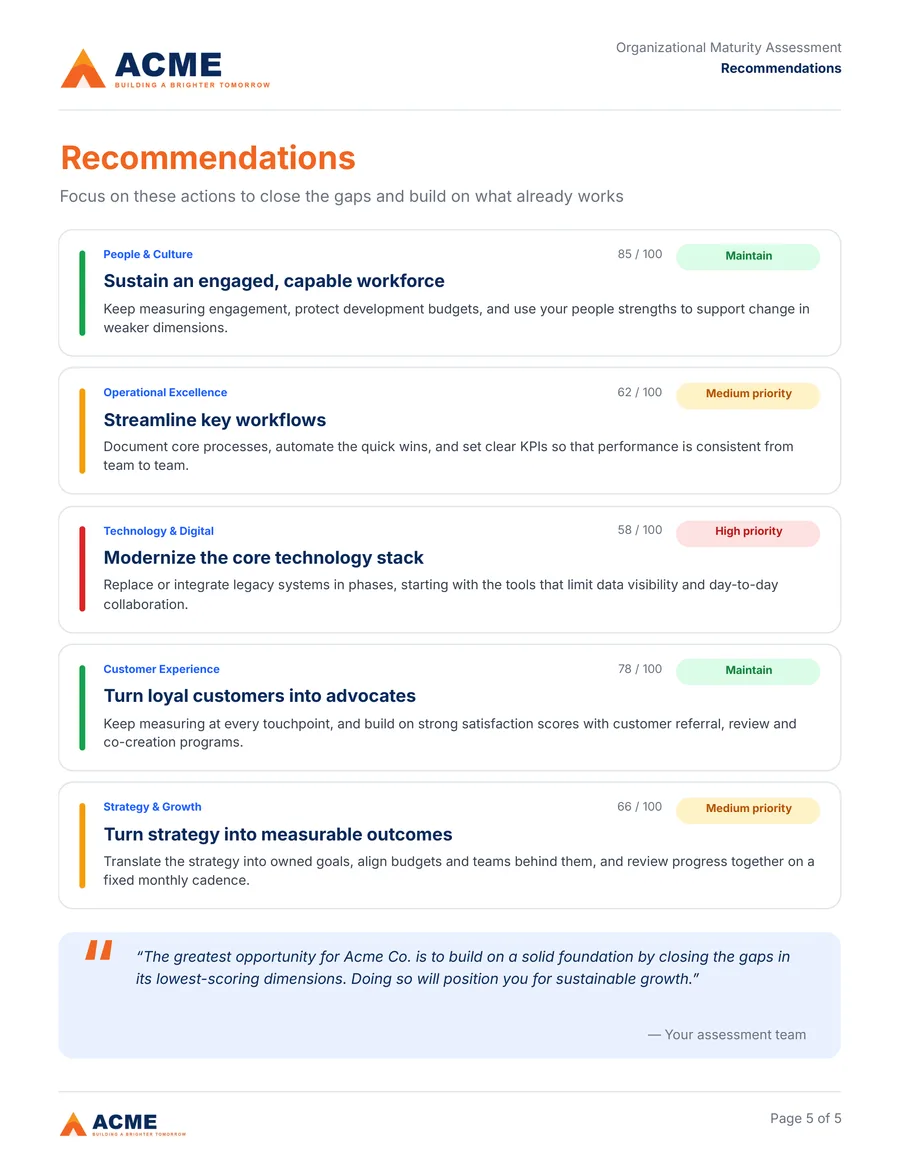
  1. People & Culture85 / 100Maintain
    Sustain an engaged, capable workforce

    Keep measuring engagement, protect development budgets, and use your people strengths to support change in weaker dimensions.

  2. Operational Excellence62 / 100Medium priority
    Streamline key workflows

    Document core processes, automate the quick wins, and set clear KPIs so that performance is consistent from team to team.

  3. Technology & Digital58 / 100High priority
    Modernize the core technology stack

    Replace or integrate legacy systems in phases, starting with the tools that limit data visibility and day-to-day collaboration.

  4. Customer Experience78 / 100Maintain
    Turn loyal customers into advocates

    Keep measuring at every touchpoint, and build on strong satisfaction scores with customer referral, review and co-creation programs.

  5. Strategy & Growth66 / 100Medium priority
    Turn strategy into measurable outcomes

    Translate the strategy into owned goals, align budgets and teams behind them, and review progress together on a fixed monthly cadence.

— Your assessment team

Page 5 of 5

What changed: The logo, brand colors and fonts. Then the scores, the charts, the status labels and colors, and the recommendations.

This is an illustrative preview built for this page, not a live spreadsheet connection. It follows the two real reports below.

See the real reports

Both PDFs were generated by Framefarm's rendering pipeline from the same five-page template, using each client's data and brand profile.

Why it is different

A designed report that follows your method and fits your workflow

Your report. Your layout.

Build a fixed-layout, multi-page report in a visual editor: place text, charts, tables and images exactly where you want them. Already have a report you like? Import the PDF as the page background and put live data on top. The imported page is a picture of your design, so you keep the look and choose which parts become data-driven.

You are not confined to a template someone else designed.

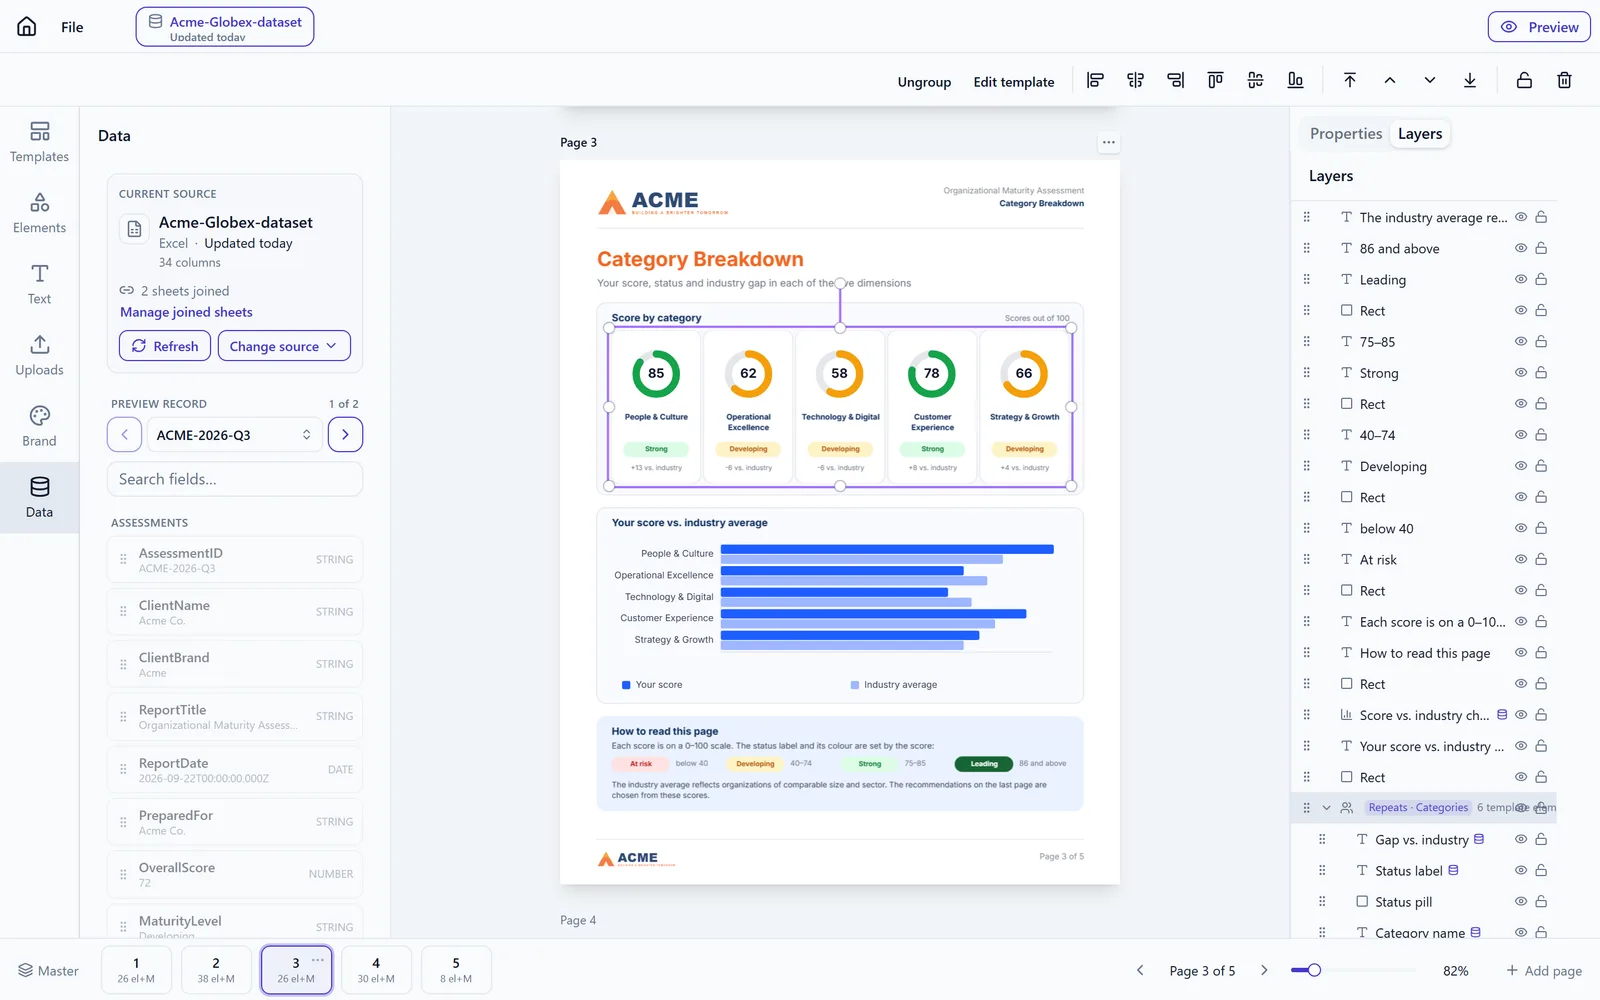
The report editor in the product with a five-page report open: the page canvas in the center, the page strip below, and the data and properties panels at the sides.

Your rules decide what the report says.

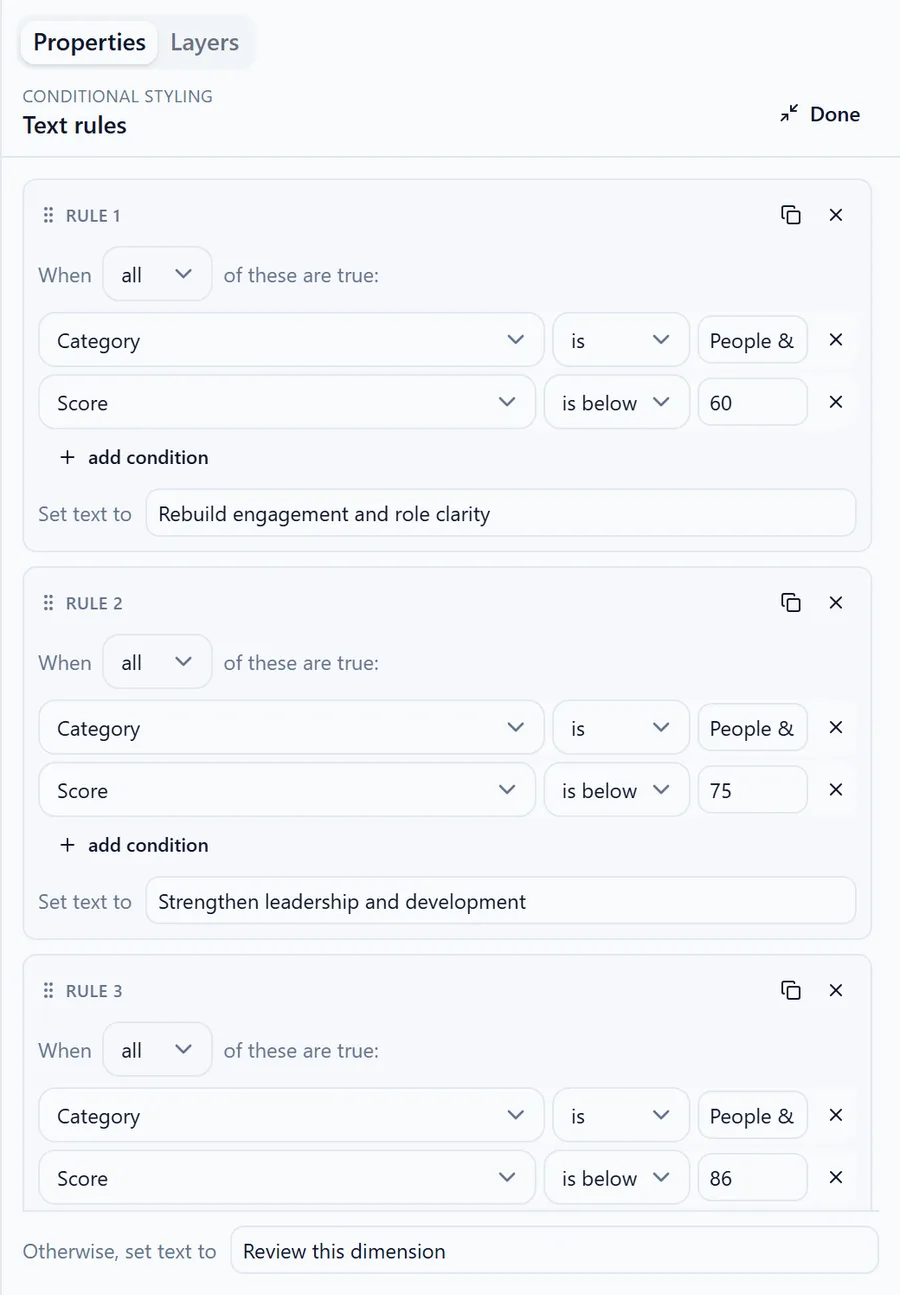
Value mappings and conditional rules control colors, status labels, chart appearance and which recommendation text appears. The recommendations are the ones you wrote, selected by rules you defined. Nothing is generated by AI.

With the same data and the same rules, the report comes out the same every time.

The rule editor in the product showing the thresholds that choose a recommendation and its priority.
The recommendations page of a real generated report, with priorities and text chosen by those rules.

Keep your tools. Upgrade your reports.

Framefarm is the reporting layer for data you already collect through forms, assessments and spreadsheets. You do not rebuild your assessment or move your data collection. You point Framefarm at the sheet and it produces the reports.

Your process stays as it is. Only the manual report production goes away.

See how it fits your workflow

Stays as it is

  • Your form or assessment
  • Your CRM and automations
  • Your spreadsheet

Framefarm replaces

  • No longer needed: Copying scores into a deck
  • No longer needed: Rebuilding charts by hand
  • No longer needed: Recoloring status indicators

Also included

  • Tables and lookups
  • Bar, line, pie, donut and radar charts, gauges and KPI tiles
  • Text that shrinks to fit
  • Brand profiles per client
  • Team workspaces
  • Figma import (SVG)
  • Batch PDF generation

How it works

From the form you already use to a client-ready PDF report

Framefarm sits between your data and the finished report. Here is what it does, and where your own tools stay involved.

  1. Your form or assessmentYour tool
  2. Your data sourceGoogle Sheets, Excel or CSV
  3. FramefarmDesign, rules, generation
  4. Client-ready PDFOne report, or a zip of many
  5. DeliveryYour email, CRM or portal
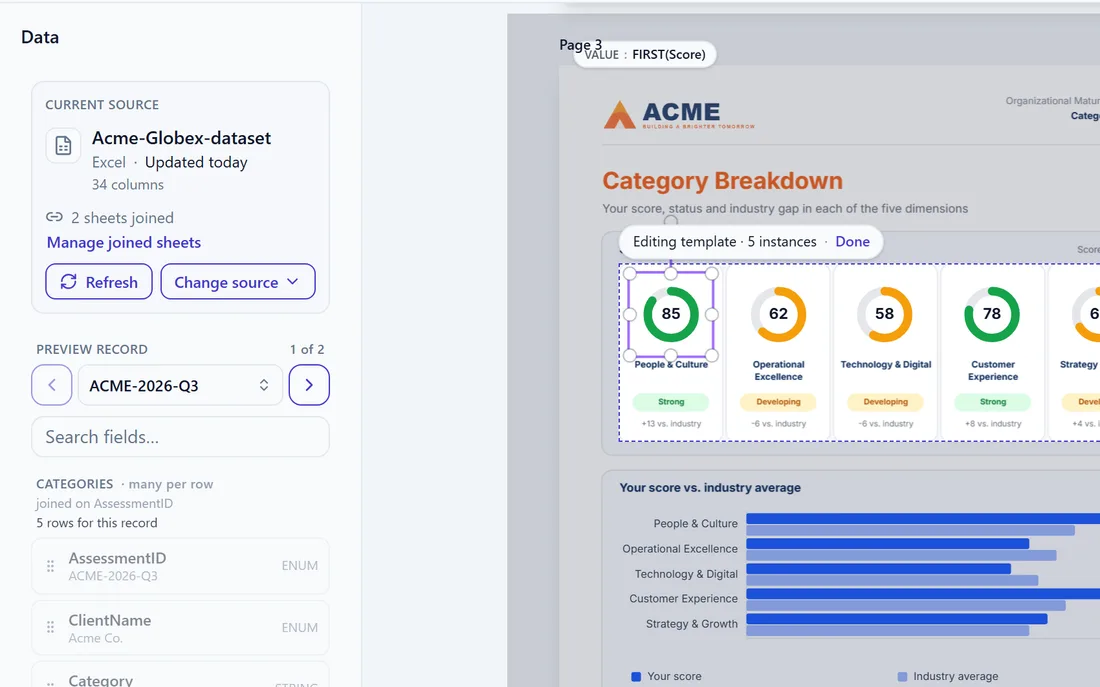
  1. The editor in the product with the category page of a report open and a chart selected.
    1

    Design the report once

    Lay out the pages in the editor, or import the PDF you send today.

  2. The data panel in the product listing the spreadsheet's columns, with a report element bound to the overall score.
    2

    Link it to your columns

    Pick a column for each text, chart and indicator, and set the rules.

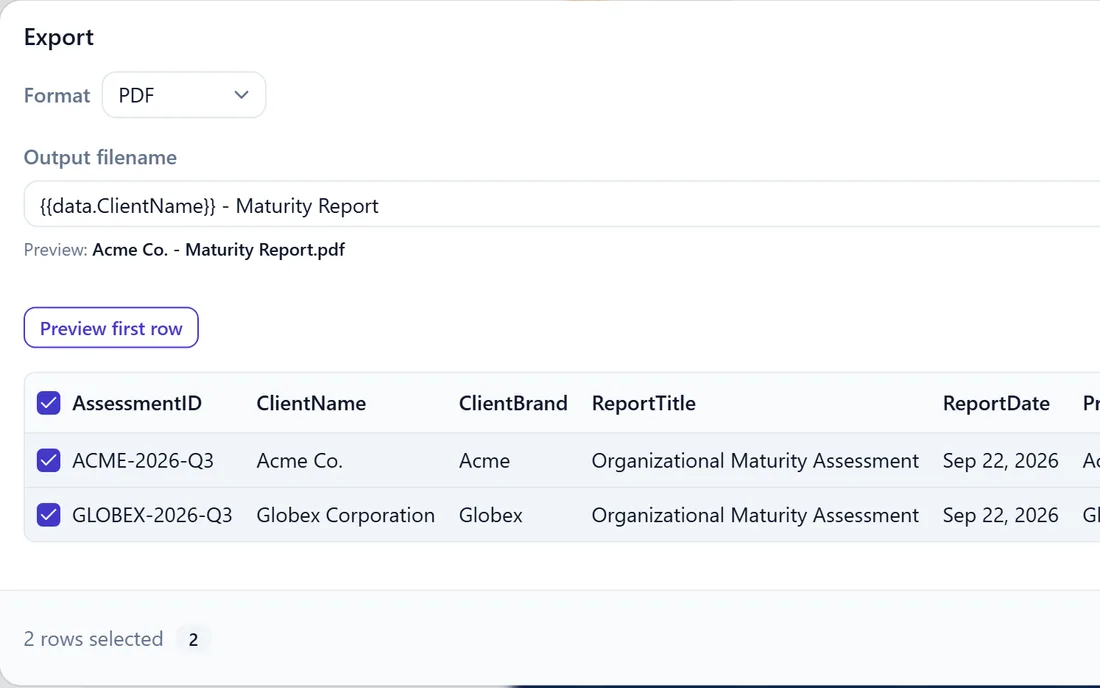
  3. The export dialog in the product with the Acme and Globex rows selected and PDF chosen as the format.
    3

    Generate for every client

    Tick the rows you want and download one PDF or a zip.

Watch it happen in the editor

A screen recording of the real product: a text bound to a column, the color rules behind the score, then the same report switched from Acme to Globex, with its categories and the rules that choose each recommendation.

58 seconds, no sound.

Built in

What Framefarm does

  • Connects to a live Google Sheet, read-only
  • Takes an Excel or CSV upload. That is a snapshot: upload again when the data changes
  • Reusable multi-page report templates
  • Text, charts and tables bound to your columns
  • Conditional rules for colors, labels and text
  • A PDF for one client
  • A batch for many clients, downloaded as a zip

Through Google Sheets

Your existing tools feed the sheet

Many form and automation tools can write each response to a Google Sheet as a new row, and Framefarm reads that sheet. Examples include Jotform, Typeform, GoHighLevel, Zapier, Make and n8n.

These are tools you already run. They are not Framefarm integrations, and you set up the connection to Google Sheets inside each tool.

API, on request

Trigger generation from an automation

For implementers. Your automation sends the report ID and one record's values. The report is queued, and you receive a private PDF link, valid for 24 hours, by checking back or through a callback.

The API generates the PDF. Sending it to your client is a step in your own automation. Ask us for access details.

Delivery

You send the reports

Download the PDF or the zip and send it from the email, CRM or client portal you already use.

Not available yet: built-in email delivery, scheduled runs, and direct connections to form tools.

Building this for a client? See Framefarm for agencies

Use cases

Built for reports that share one skeleton

Same pages, same charts, same scale. Different numbers for every client, location or participant.

  • Maturity or readiness assessment

    Consultancies that score clients across categories and send a level, a chart and a plan.

  • Exit-readiness scorecard

    Advisors who grade a business across dimensions ahead of a sale or investment.

  • Monthly client KPI report

    Agencies and multi-location operators who send the same measures to many clients every month.

  • 360 feedback summary

    Coaches and HR consultants who turn survey scores into a personal report.

Start free

Before and after

The report is still a manual production job. It does not have to be.

Sarah runs a small consultancy. Every assessment ends with an afternoon in a slide deck: paste the scores, rebuild the charts, recolor the indicators, swap the recommendations. Then again for the next client.

StepBy hand, in a deckWith Framefarm
The designDuplicated and adjusted for every clientDesigned once, reused for every client
The chartsRe-made by hand or pasted in as screenshotsDrawn from the data, every time
The status colorsRecolored by eyeSet by thresholds you define
The recommendationsParagraphs swapped in by handChosen by your rules
The next clientStart overPick the next row
The mistakesThe last client's name slips throughNothing is copied, so nothing slips

Where it fits

Compared with the other ways to produce a PDF report with charts

Each of these works well for some jobs. Here is when Framefarm is the better fit.

  • Slide decks and design tools

    Works well when
    You produce a handful of reports and want full manual control over each one.
    Framefarm fits when
    The design is settled and the repetition is the problem: the same charts, values and recommendations updated by hand for every client.
  • PDF builders inside form tools

    Works well when
    You need a clean record of a submission or an ordinary document, built where the form lives.
    Framefarm fits when
    You need a more customized multi-page report, specific chart layouts, score-driven presentation, or closer control of the design than your form tool makes convenient.
  • All-in-one assessment platforms

    Works well when
    You want to build the assessment and its report together inside one platform.
    Framefarm fits when
    The assessment already exists somewhere else, or you want independent control of the report design and how reports are produced.
  • PDF generation tools and APIs

    Works well when
    You have a development team, or documents of many kinds to generate from code or templates.
    Framefarm fits when
    Your work is assessment reports and your data is in a spreadsheet: one place for visual design, data binding, rules and generation.

If your current assessment platform already produces the reports you want, you may not need Framefarm.

Questions, answered

Do I need to code?

No. Reports are built in a visual editor, and a report element is linked to a spreadsheet column by picking the column from a list. A rule such as a score under 40 turning red is set with a threshold control, not a formula.

Which data sources can I use?

A Google Sheet, connected live with read-only access, or an Excel (.xlsx) or CSV file you upload. An uploaded file is a snapshot, so you upload a new version when the numbers change. Form and automation tools that write their results to a Google Sheet work through that sheet.

Can I use my existing report design?

Yes. Import the PDF you send today and each page becomes the background of a report page; then place live text, charts and indicators on top. The imported page is a picture of your design, so its original text and shapes are not individually editable. Designers can also import a Figma layout exported as SVG, which arrives as editable elements.

Does Framefarm write the recommendations with AI?

No. The recommendation text is yours. You write it once, and the rules you define decide which text appears for each client. The same data and rules always produce the same report.

How are reports generated and delivered?

You pick one or more rows in the export dialog. One row downloads a single PDF; several rows download a zip with one report per row. You then send the reports from your own email or client portal. Built-in email delivery and scheduled runs are not available yet.

What do I get if I upgrade?

The Free plan includes the full editor, every data source, charts and rules, with up to 3 report designs, 10 reports per batch, and a watermark on PNG and JPG exports. Paid plans raise those limits (Starter allows 25 designs and 100 reports per batch; Pro allows 200 and 1,000), remove the image watermark, and add custom font uploads and 5 logo variants per brand profile. PDF reports are never watermarked on any plan.

What happens to my data?

Your spreadsheet stays where it is; Framefarm reads the rows when you generate. Generated reports are private and downloaded through time-limited links, zip bundles expire after seven days, and older generated files are purged automatically.

Can I cancel anytime?

Yes. A subscription is managed from the billing page of your workspace and can be cancelled at any time. The Free plan needs no card and does not expire.

Founder-led offer

Looking for 10 design partners.

Have an assessment report you currently build by hand? We'll help convert one qualifying report into a reusable Framefarm template at no charge.

What the free setup covers

  • One report of up to 5 pages
  • Based on a report design you already have
  • Built with sample data you supply
  • Subject to a short qualification and scope review

Custom integrations and bespoke product development are not part of the offer.

Design it once. Let the data do the rest.

Connect your spreadsheet, build the template, and generate a branded report for every client.